Environment
Apache Spark 1.3.1 (local mode) + PySpark + IPython Notebook
Dataset
The 20M dataset from MovieLens contains 20 million ratings on 27,000 movies by 138,000 users. It includes four csv files, only the ratings.csv and movies.csv are used here. They each contain several columns as shown in the table below.
| ratings.csc | movie.csv |
|---|---|
| userId, movieId, rating, timestamp | movieId, title, genres |
Due to limited computational resources and for the purpose of speeding up implementation and experiments, I sample a small dataset from the original one.
Sampling
Firstly, generate a set containing all the users in the ratings.csv file, then sample 3000 users from the set. These users are selected at random. Then filter out users who has rated less than 20 movies from the 3000 users.
After that, filter and keep rating records from the chosen users in the ratings.csv file, assign new id for those chosen users and finally output those new rating records to a file.
The final small dataset contains about 140,000 ratings from 1,700 users on about 27000 movies.
Split data
10 different random seeds are used to split dataset for 10 rounds.
For each round, the dataset is splitted into three parts, namely the training set, validation set and test set, which makes up 60%, 20%, and 20% of the dataset respectively. The training set is used to train the recommendation prediction models, the validation set is for tuning the hyper-parameters of the models and the test set is for checking the performance of the models.
Error Measurement
For measuring the difference between the predicted rating score using different techniques (baseline, user based, and matrix factorization) and the actual rating score in the test set, the Root Mean Square Error (RMSE) and the Mean Absolute Error (MAE) are adopted.
The RMSE is the square root of the average value of the square of (actual rating - predicted rating) for all users and movies for which we have the actual rating. The RMSE serves to aggregate the magnitudes of the errors in predictions for various times into a single measure of predictive power. For two ratings RDDs, x and y of size n, RMSE is defined as below.
MAE is a quantity used to measure how close predictions are to the eventual outcomes. For two ratings RDDs, x and y of size n, MAE is defined as below.
BASELINE
Rating Prediction
As a naive baseline, the average rating score of a user is used to predict his or her ratings on the movies not rated by him or her yet. Because there is no hyper-parameters to tune in this baseline approach, the splitted training set and validation set are unioned to form new training set and compute average rating score of a user based on this new training set.
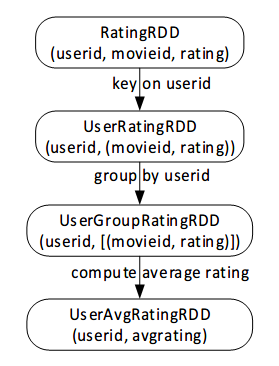
The operation flow to compute the average rating score for every user is shown in the figure below.
For 10 different runs, the average RMSE on test set is 0.952338, average MAE is 0.740086.
Recommendation
For this baseline approach, the 30 highest rated movies in the whole dataset are always recommended to users. Movies with high average rating score but no more than 100 ratings are filtered out, because movies with few ratings may not have broad appeal to everyone.
USER BASED
User-based method is a neighborhood-based collaborative filtering approach. Update!!
Similarity measurement
There are several ways to measure the similarity of different users, e.g. cosine similarity, jaccard similarity and Pearson correlation similarity.
The cosine similarity is adopted here. Shown in this formula, cosine similarity equals to the sum of product of each feature pair in users’ feature vector and then normalized by inner product of users.
Process flow
Implementing user based approach involves three phases: neighborhood formation, rating prediction and recommendation generation.
The following figure shows the operation flow chart of how to generate a neighborhood for every user.
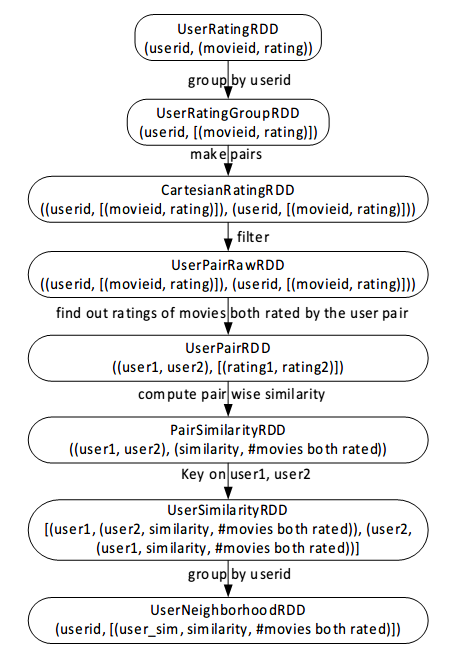
Cartisian + filter is quite memory consuming. Actually, there is another way to construct the UserNeighborhoodRDD. That is, transform the RatingRDD containing (userid, movieid, rating) tuples into new RDD which contains (movieid, (userid, rating)) tuples, then group it by the key – movieid to get a new RDD. Then based on this new RDD, we can generate the UserPairRawRDD avoiding the Cartisian and filter operations.
Tuning hyper-parameter
The size of the neighborhood is the only hyper-parameter in the user based approach.
The validation set is used to see how the model perform as the size of neighborhood varies from 30 to 200.
The following two figures show how the validation error (RMSE, MAE) changes along with the size of neighborhood.
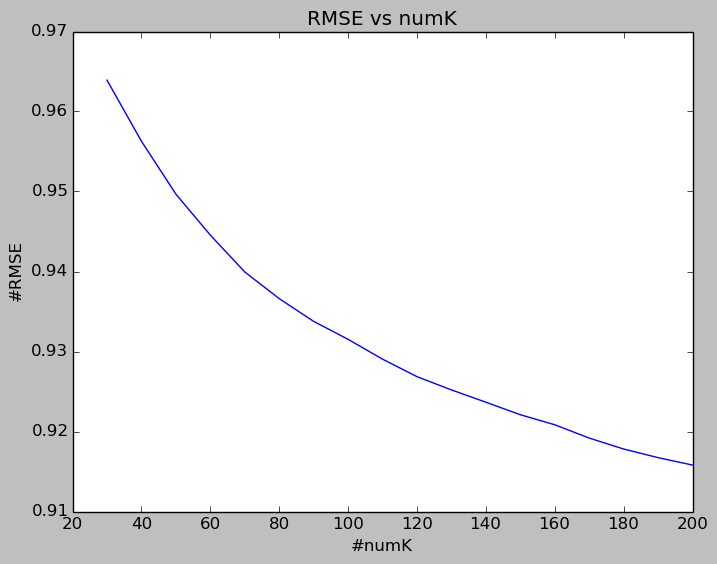
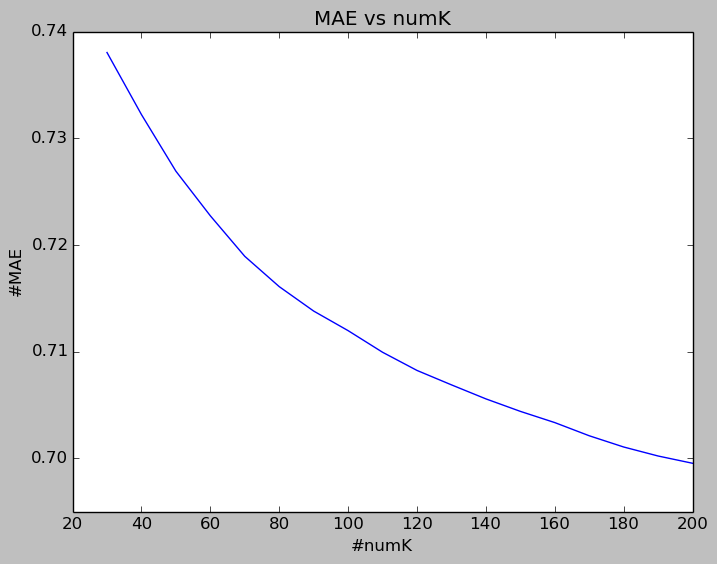
RMSE and MAE both decrease gradually when size of neighborhood goes all the way up to 200. Also, their decreasing speeds both slow down quite a lot when size of neighborhood grows from 100 to 200. Therefore, if we want to reduce computational efforts while still getting quite reasonable results, we can set the size of neighborhood as about 100.
Here I didn’t experiment with numK greater than 200. Notes that it may not be true that the larger the numK is, the lower the prediction error is when numK exceeds certain threshold. Also, a larger numK means more computational cost.
Rating prediction and performance
Users’ ratings on movies which they haven’t rated yet are predicted using the formulas below. They not only consider the average rating score of the user, but also take the preference of his or her neighbors into account.
$$ {r_{u,i}} = \bar {{r_u}} + k\sum\limits_{{u'} \in U} {simil(u,{u'})({r_{{u'},i}} - \bar {{r_{{u'}}}} )} $$For 10 different runs, the average RMSE on test set is 0. 0.917317, average MAE is 0.701241.
Recommendation
For a random user A, first gather all the movies that have not been rated by A but already rated by at least one of his or her neighbors. Then we predict A’s rating on those movies by the formulas shown in the last subsection. After predicting the rating of each movie, K highest rated movies by predictions will be recommended to the user.
LOW-RANK MATRIX FACTORIZATION
Basic idea
Matrix factorization is to factorize a matrix, or to find out two or more matrices such that if we multiply these matrices we will get the original matrix back. Usually, the new matrices contain the latent features, and the number of latent features are small, i.e. the rank of these matrices are small, that’s why we call it low-rank matrix factorization.
Firstly, we have a set of U users, and a set of D movies. Suppose R is the matrix that contains all the ratings in the data, which is of size U * D. Assume that we want to find out K latent features. So we need to find the user feature matrix P and a movie feature matrix Q, such that $$ R \approx P \times {Q^T} = \hat R $$
In this way, each row of P would represent the strength of the associations between a user and the features. Similarly, each row of Q would represent the strength of the associations between a movie and the features. To get rating prediction of a movie by a user, we can calculate the dot product of two feature vectors corresponding this movie and this user $$ \hat r = {P_i}^T{Q_j} $$
Alternating least square
The recommendation module of Spark MLlib is implemented through alternating least square algorithm (ALS). ALS does low-rank matrix factorization by firstly initializing the user feature matrix with some random values, and use the known ratings to find the best values for the movies feature matrix by minimizing the regularized square error between the predicted ratings and the actual ratings through gradient descent. The error and the update rule are as below.
$$ {e_{ij}}^2 = {({r_{ij}} - \sum\nolimits_k^K {{P_{ik}}{Q_{kj}}} )^2} + \frac{\beta }{2}\sum\nolimits_k^K {{Q_{kj}}^2} $$ $$ {Q_{kj}} = {Q_{kj}} + \alpha (2{e_{ij}}{P_{ik}} - \beta {Q_{kj}}) $$Then it holds the movie feature matrix and optimizes the values of the user feature matrix. The error and the update rule are as below.
$$ {e_{ij}}^2 = {({r_{ij}} - \sum\nolimits_k^K {{P_{ik}}{Q_{kj}}} )^2} + \frac{\beta }{2}\sum\nolimits_k^K {{P_{ik}}^2} $$ $$ {Q_{kj}} = {Q_{kj}} + \alpha (2{e_{ij}}{Q_{kj}} - \beta {P_{ik}}) $$Keep doing in such alternating manner until getting satisfactory results.
Tuning hyper-parameters
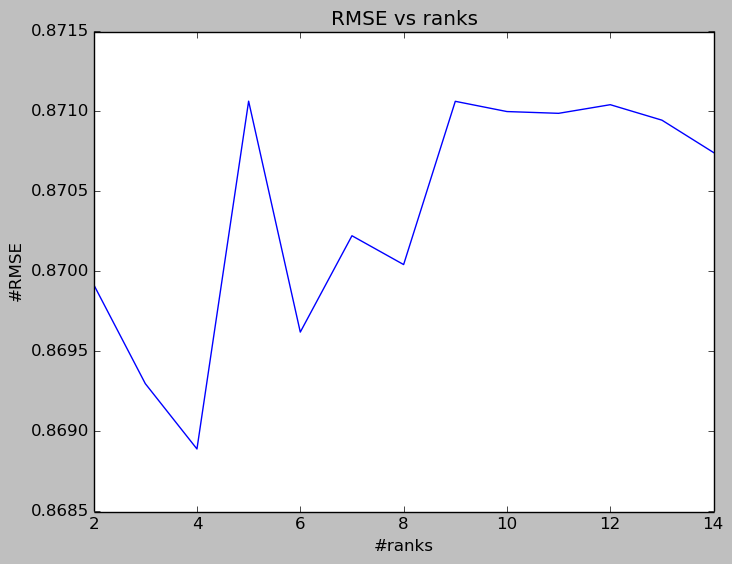
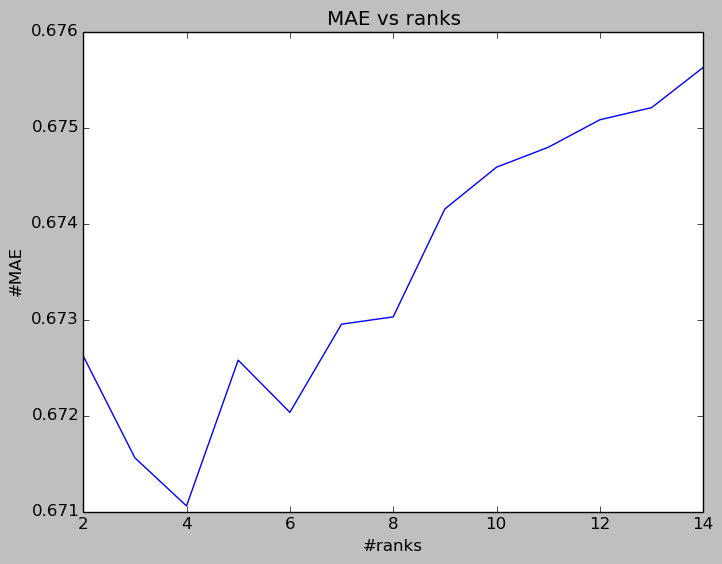
The rank is one of the important parameters that we need to tune. A lower rank will mean higher error on the training dataset, but a high rank may lead to over-fitting. The following two figures show how the average RMSE and MAE for 10 different runs varies against the rank. We can see that when the rank equals 4, we can get the smallest validation error.
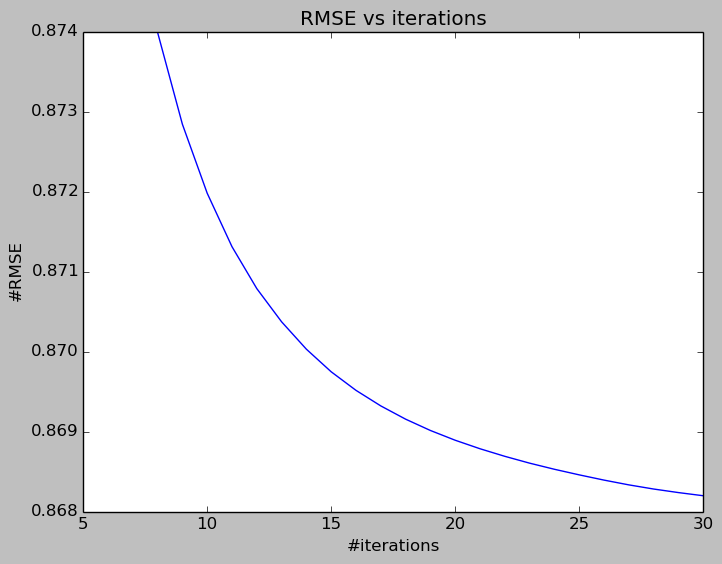
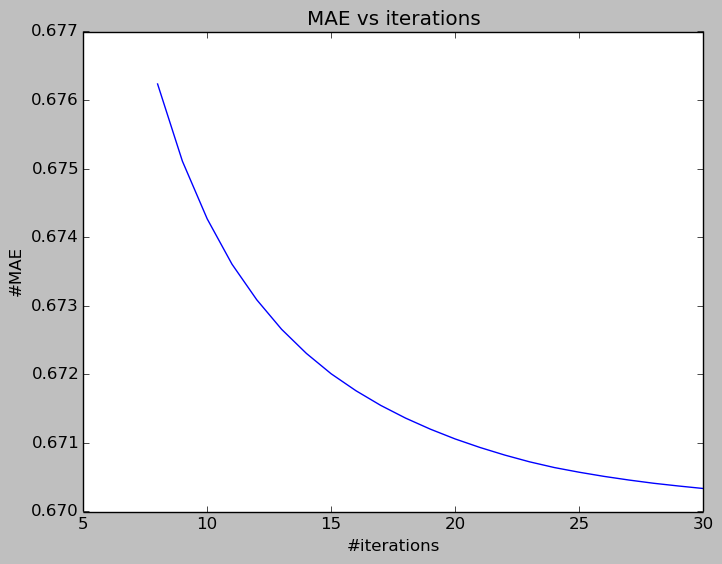
The following two figures show the trend of average validation error (RMSE and MAE) against the number of iterations. The error rate drops quite quickly until the 15th iterations, the rate of decreasing is much smaller from the 15th to 30th iterations. So we can set the number of iterations as 12 to reduce computational efforts while still getting quite a reasonable error rate.
Performance and Recommendation
As for rating score prediction, for a random user i which corresponds a row \(P_i\) in the user feature matrix, we can get his ratings on all the movies by multiply \(P_i\) and the whole movie feature matrix.
With hyper-parameters (rank = 4, number of iterations = 20), the average RMSE on the test set is 0.872306, average MAE is 0.674701.
As for recommendation, for a random user, simply sort the predicted rating scores for all the movies which he or she hasn’t rated, and get the top rated movies to recommend.
Comparison & Conclusion
From my implementation and experiments, the user based method performs OK, however, it is a memory based approach, meaning that we have to use all of the user-movie rating information to compute prediction and recommendation result even just for a single user. So, the computational complexity is too high, its scalability is not so good. The low-rank matrix factorization achieves the smallest error, and its scalability is good.
However, there is still much room for improvement. It’s necessary to incorporate other techniques to improve performance, for example, utilizing other data features in the dataset, cooperating with content-based approach and so on.
Postscript
F.Y.I. With Spark’s built-in recommendation module, it is not difficult to build an on-line recommendation system. If you’re interested, you can check this blog